Validating Audio Analyses for MMMAudio
posted January 20, 2026
MMMAudio is a new framework for creative coding music and sound created by Sam Pluta. The audio engine is being built from scratch in a new programming language called Mojo, which is designed be be interoperable with Python. Because I use a lot of audio analyses in my work, I am implementing some in MMMAudio so I can start using it as a core part of my practice. The first three I undertook were: RMS, Pitch (YIN), and Spectral Centroid. All three were modeled after FluCoMa’s implementations.
In order to ensure that they were implemented correctly, I chose two other trusted toolkits to compare against: FluCoMa and Librosa. I wanted to use two others in order to triangulate between all three. I assumed my analysis would never exactly match another because of differences between languages (or at the very lease because of floating point precision since MMMAudio is all computed using 64 bit floats), so I wanted to validate by making sure that the analyses in MMMAudio were as similar to FluCoMa and Librosa as FluCoMa and Librosa are to each other.
I wrote a script to test (quickly in non-real-time) all three audio analyses of the same audio file in FluCoMa (SuperCollider), Librosa (Python), and MMMAudio (Mojo). These analyses are dumped into csv files and then plotted against each other.
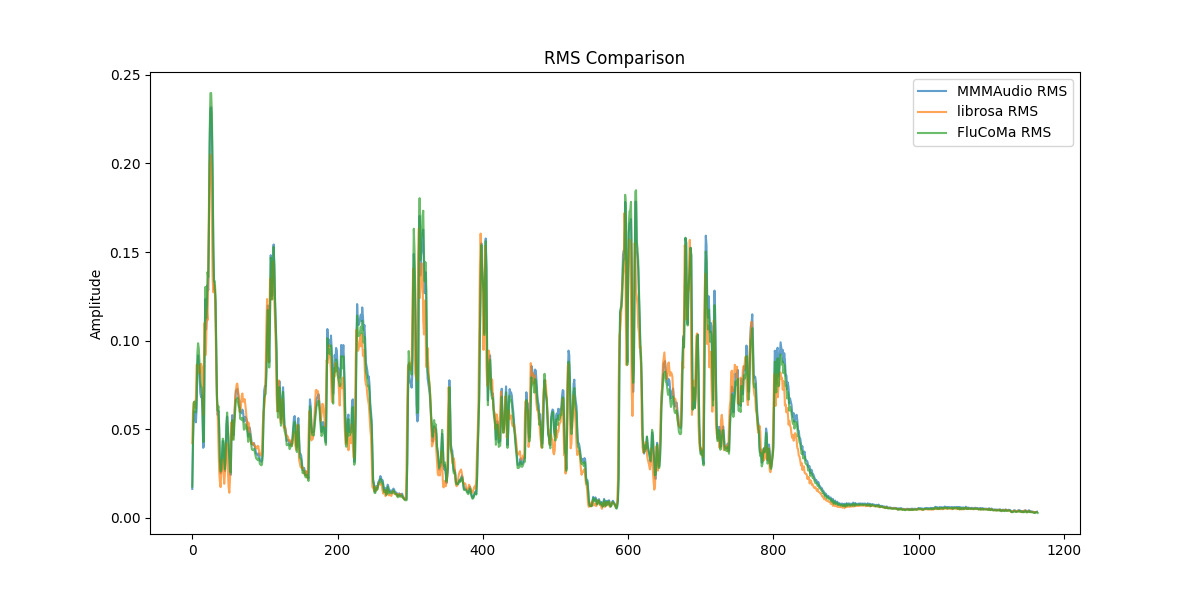
RMS
| Comparison | Mean Difference | Std Dev of Differences |
|---|---|---|
| MMMAudio vs Librosa | -42.54 dB | -38.48 dB |
| MMMAudio vs FluCoMa | -52.30 dB | -50.34 dB |
| Librosa vs FluCoMa | -42.80 dB | -38.25 dB |
That’s not off by 42 dB, that’s a difference in amplitude that is -42 dB (amplitude = 0.0074644875841007).
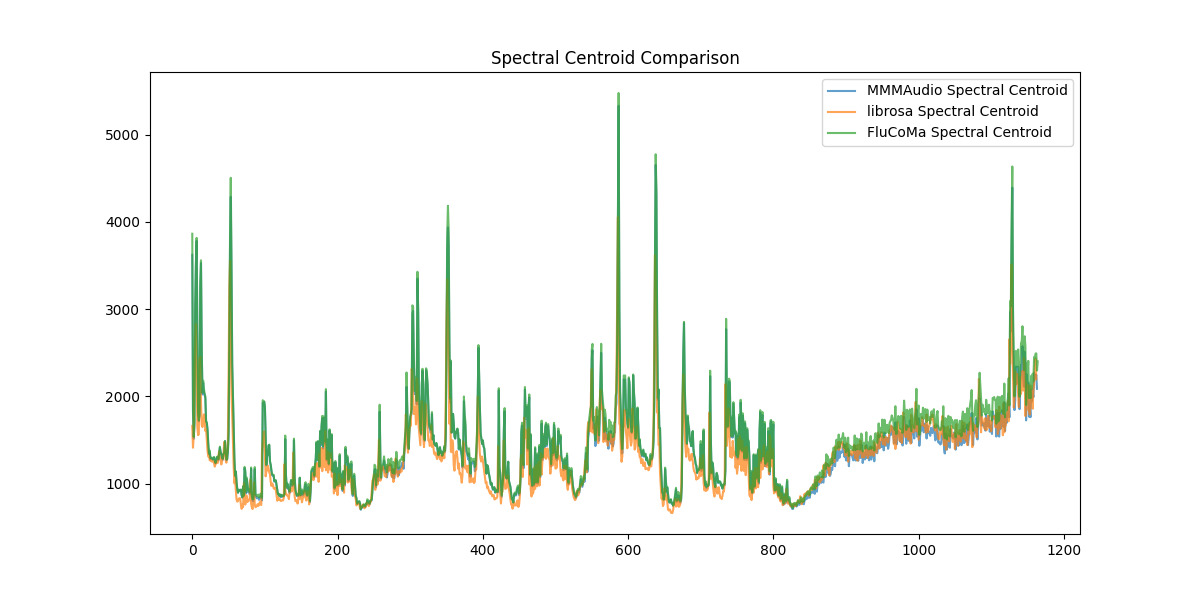
Spectral Centroid
Almost precisely matches with FluCoMa
| Comparison | Mean Difference | Std Dev of Differences |
|---|---|---|
| MMMAudio vs Librosa | 184.17 Hz (2.16 semitones) | 286.12 Hz (2.74 semitones) |
| MMMAudio vs FluCoMa | 60.46 Hz (0.66 semitones) | 66.11 Hz (0.63 semitones) |
| Librosa vs FluCoMa | 204.72 Hz (2.35 semitones) | 286.10 Hz (2.58 semitones) |
Pitch (using YIN)
YIN’s accuracy was harder to quantify because it’s a more complicated algorithm that is quite sensitive. At first glance, the stats don’t look great, but looking at the plot it looks ok. One needs to remember that when the signal is not very pitched, this algorithm will not do well, so a lot of the inaccuracy of the stats below are probably from those moments in the analysis! There are also points in all three frameworks’ YIN where it jumps up high or down low for just one or two frames, then back to the “real” pitch, however, this happens at different times for the different frameworks, again, making the stats below probably look and feel worse than they are.
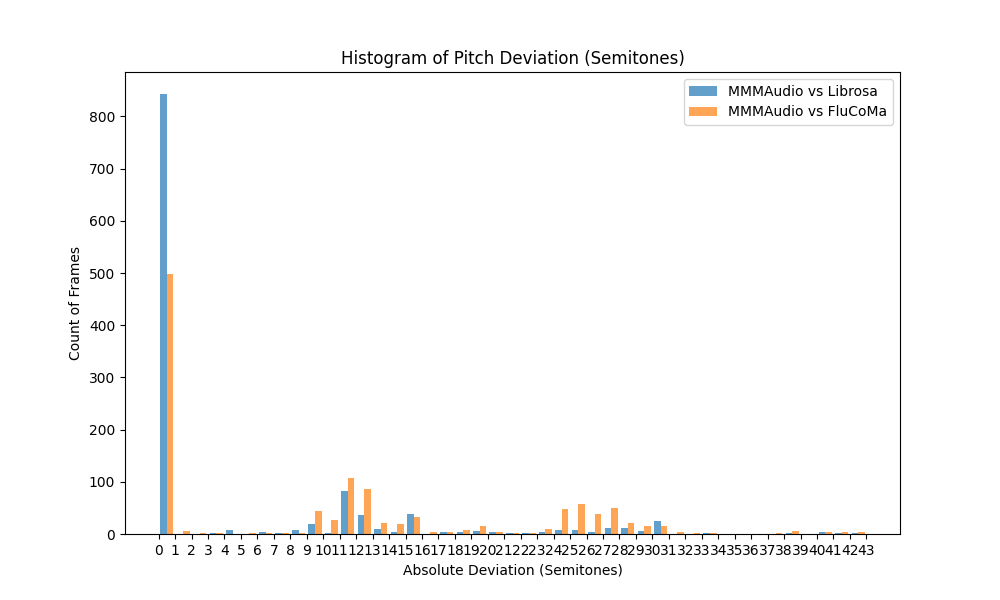
The histogram tells the real story. The vast majority of the analyses are within 1 semitone of Librosa and many are within one semitone of FluCoMa. Then there are many that are about 12 semitones off (presumably for overtone series reasons). There are also some analyses that are around 60 semitones off. I believe these are due to the algorithm outputting an unnaturally low frequency (for example MIDI note “0”) if “no” pitch is detected. Because the pitched content of the source is around MIDI note 60, I think being off by about 60 semitones represents those moments: where one analysis is reporting MIDI note “0” and another is reporting the “correct” analysis around MIDI note 60.
| Comparison | Mean Difference | Std Dev of Differences |
|---|---|---|
| MMMAudio vs Librosa | 73.02 Hz (4.72 semitones) | 169.49 Hz (8.98 semitones) |
| MMMAudio vs FluCoMa | 169.81 Hz (10.82 semitones) | 222.74 Hz (11.39 semitones) |
| Librosa vs FluCoMa | 113.65 Hz (6.89 semitones) | 178.50 Hz (9.74 semitones) |
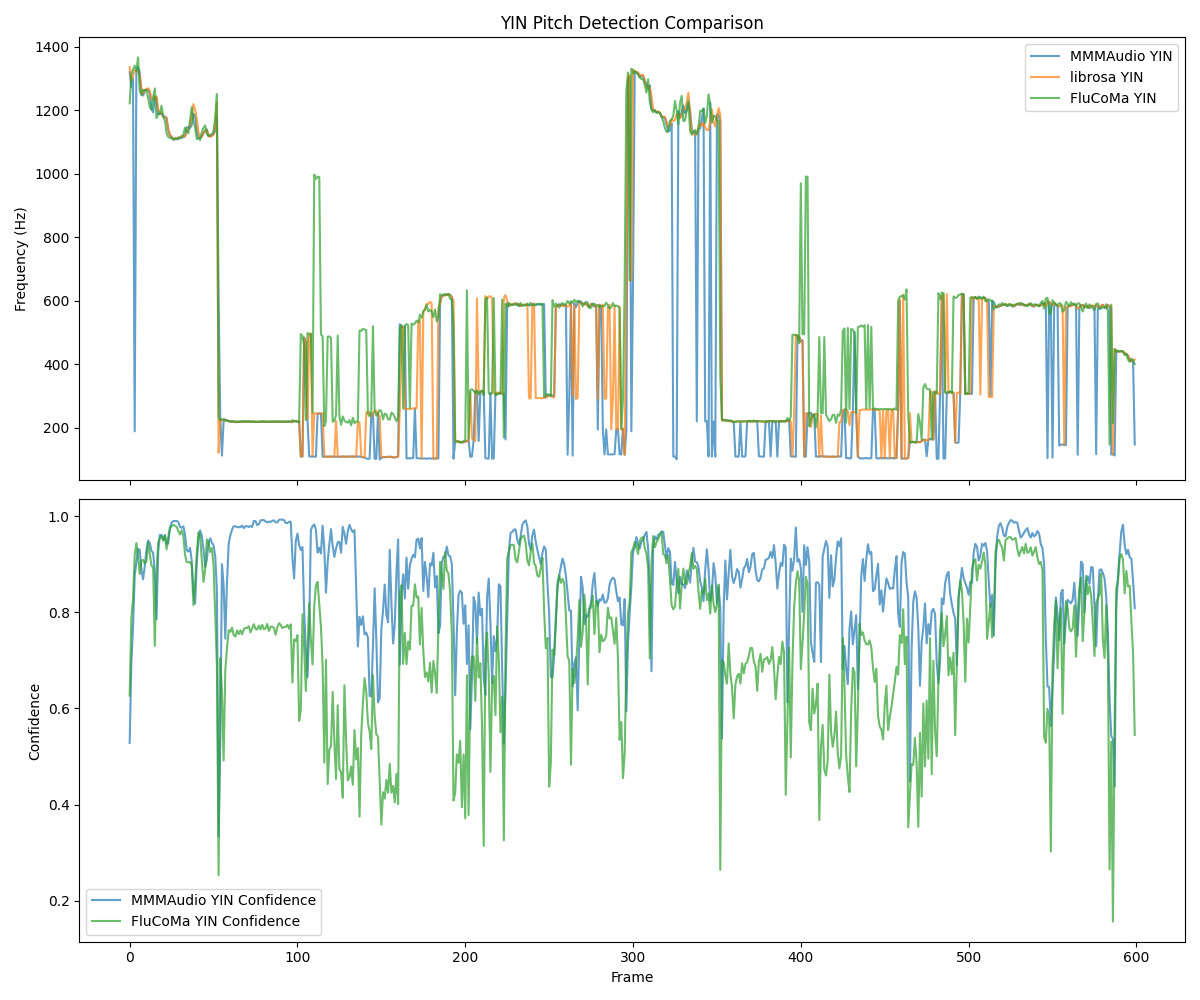
Pitch Confidence
The pitch confidence tracks with FluCoMa’s pitch confidence (Librosa doesn’t report this), but is generally higher. This is worth investigating further.
| Comparison | Mean Difference | Std Dev of Differences |
|---|---|---|
| MMMAudio vs FluCoMa | 0.1881 | 0.1512 |